Babies and Moons
I have a short story I want to share. I was in the labor and delivery unit on an OB rotation and made a comment that, because that night happened to be a harvest and full moon, the night team would have their work cut out for them. A voice of someone who overheard the comment said “you know that’s been disproven, right?” While I imagined it probably is had been, the researcher in me also wanted to see the data for myself to see what the case was.
I started where most people might start: reading the wikepedia page on the topic [here]. Of course, while many studies find no significant correlation, there are some that do find a correlation! I also looked on pubmed to see how strong the consensus was. To my surprise, most studies are either single center studies, and at most contain 10’s of thousands of births, or are only over a few years, limiting how many full moons are observed. Further, many of studies didn’t verify any statistical assumptions, which are very much violated if the right nuisance regressors aren’t included, like day of the week. I thought, surely birth data is compiled at a national level?
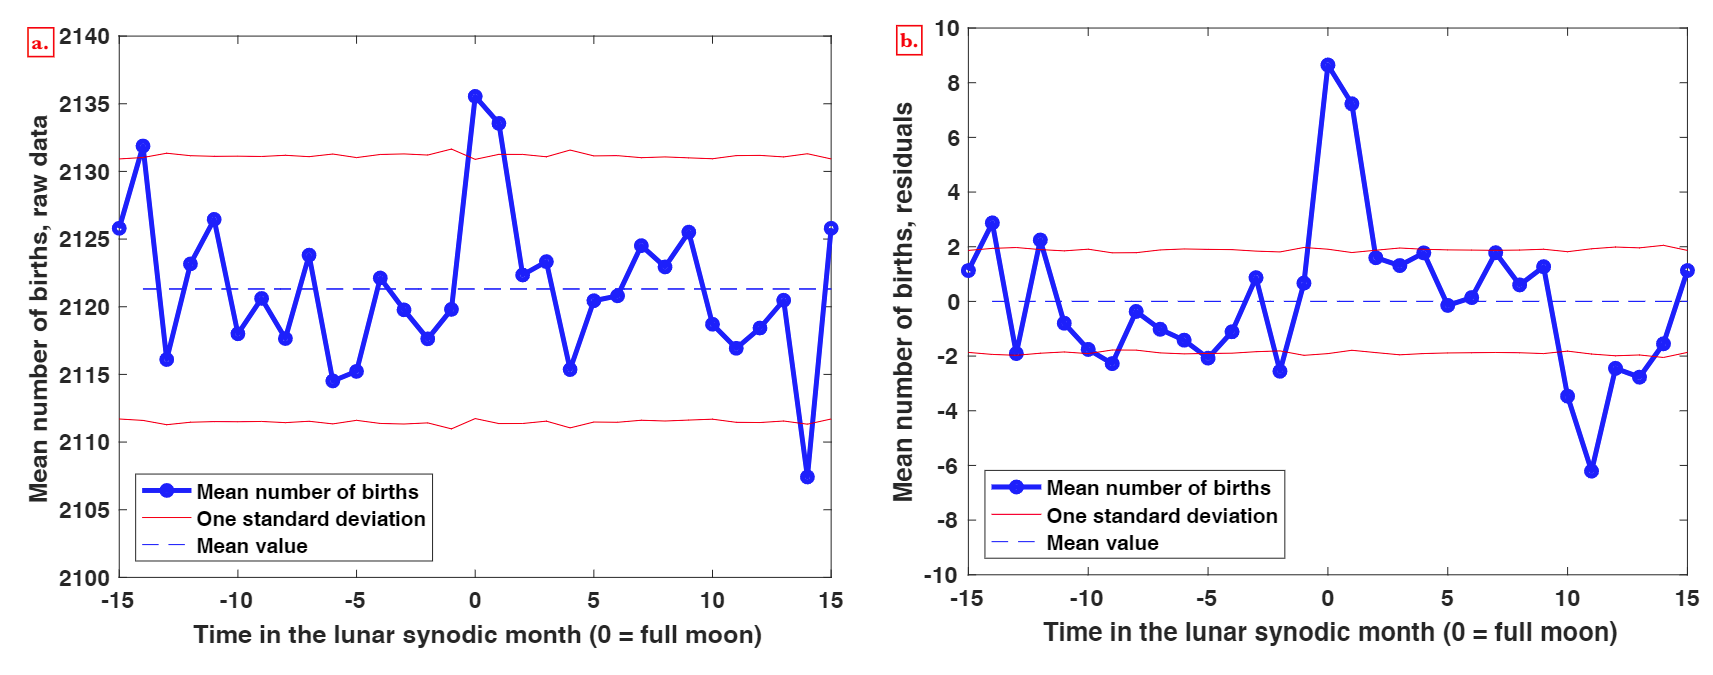
To that end, one of the studies stands out among the others as it looks at all the birth data across France over a 50-year time period (38.7 million births from 1968-2019). The data is freely and publically available from the French National Statistics and Economic Studies Institute (INSEE; data here). I highly recommend people read their short paper, and verify for themselves how good their methods are. In brief, it is probably the most rigorous paper on the topic. I quote from their abstract here:
A likelihood ratio test is used to reject that the residual means for the 30 days of the lunar month all equal 0 (p-value = 5 × 10⁻⁵): the residuals show very small but highly significant variations in the lunar month due to an increase of births at full moon and the day after. The reason for the very small increase of birth at full moon is not investigated but can be suspected to result from a self-fulfilling prophecy.
Later in the paper, they state:
In this paper, we provide the detailed analysis of a long series of birth data, and to the best of our knowledge, it is the first time that a surplus of births on full-moon days is observed (in mean), with a statistical significance high enough to leave no doubt.
The paper controlled for nuisance variables and tested for normality of residuals using multiple methods before applying a \(\chi^2\) criterion.
The relevant figure of their results is reproduced here:

After reading this paper, I had to look to see if the CDC reported this data in the US!
CDC Vital Data
Quickly looking for birth data in the US will take you to the CDC vital page. After downloading some data to see how much of an endeavor analyzing birth frequency, I discovered the us only releases birth data with dates of birth (DoB) before 1988. After 1988, the data is obscured to only show month and day of week.

Too bad :frown:
At first I was deterred, but I kept scrolling around the different CDC pages, and then found a page with some PDFs. One of these PDFs tabulated births by date!

These PDFs existed for 10 years (1994-2003). I then thought it shouldn’t be too bad to download these PDFs, import the tables into python, and calculate lunar phases for each day!

Analyzing the data
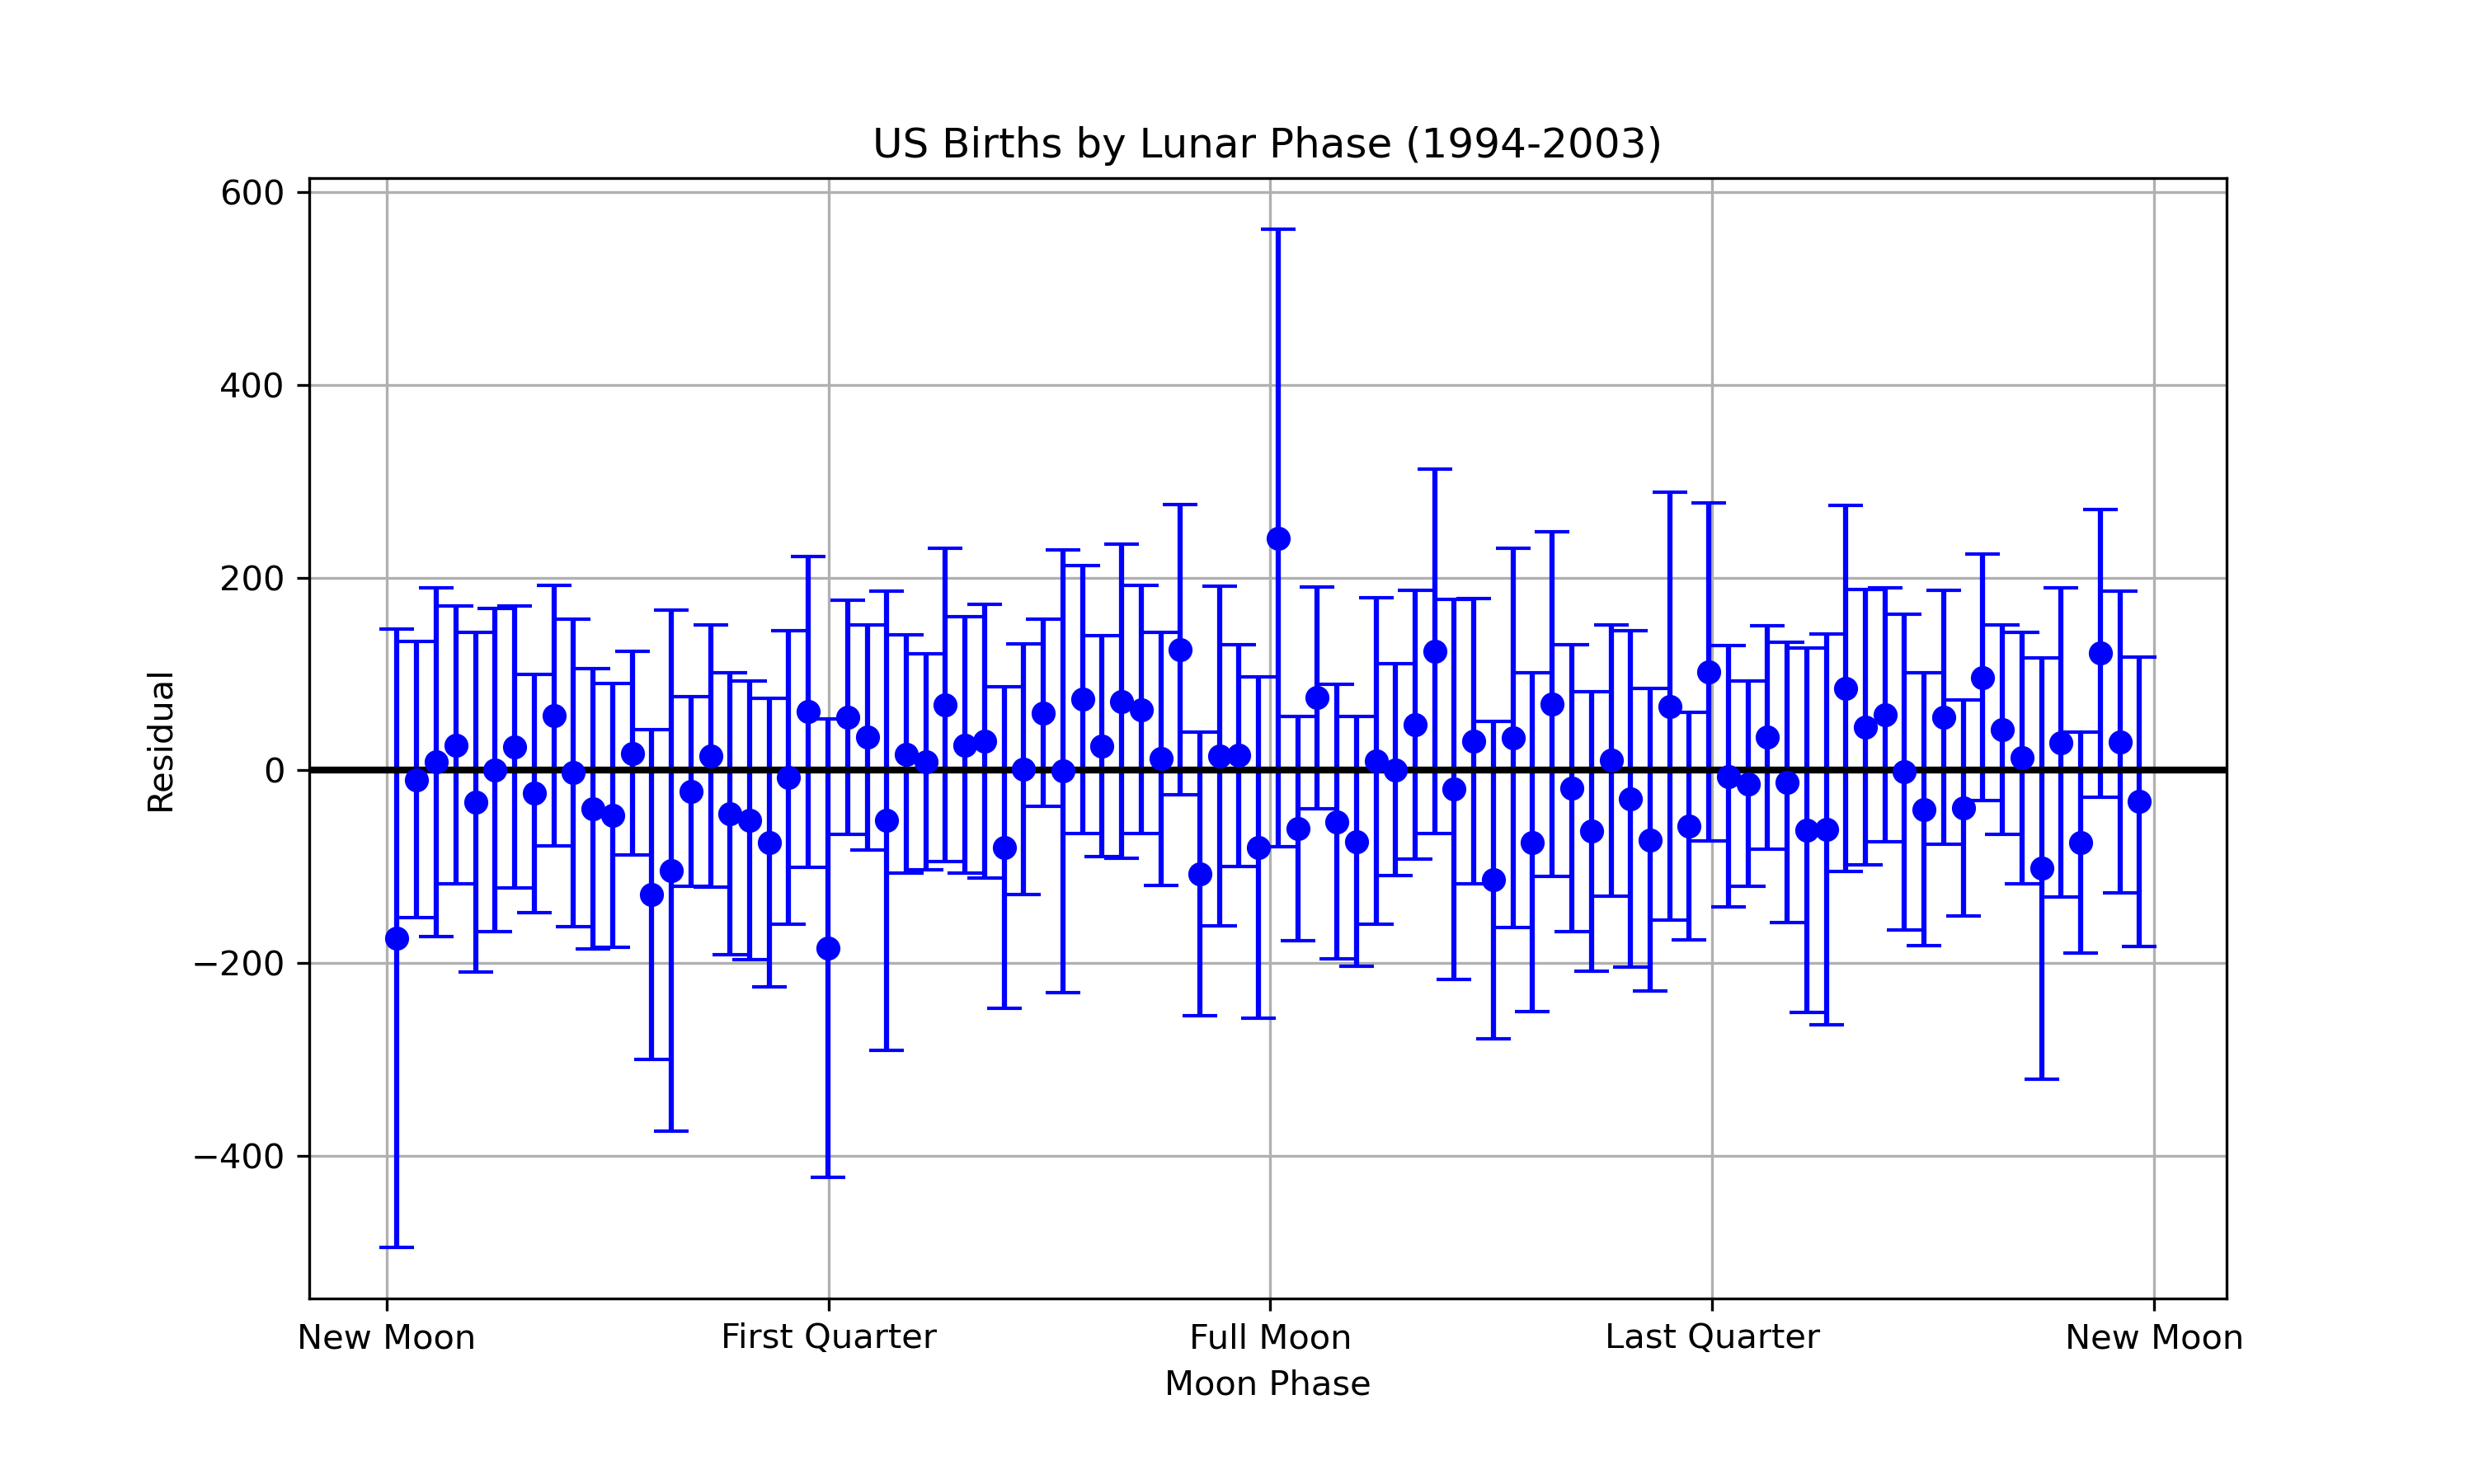
The code to process these PDFs will be posted on GitHub once I clean it up a bit. Some key parts of the dataset is that there are 39.7 million births and 123 full moons over 3,652 days. As seen in the French dataset, a quick glance of the data shows strong periodicity quick glance at the data shows strong periodicity. The most obvious trends are that weekends and holidays have fewer births than weekdays, and that the number of births increases during the summer months. To control for these effects, I created a dummy regressors for each day of the week, each month, the 12 federal holidays (and their observances), and a linear trend. The results of this regression are shown here: Regression output
I then calculated the moon phase for each day of the dataset. I binned the phases into 90 bins and calculated the mean and 95% confidence intervals for each bin. The results are below:
Regression
And finally, after binning and averaging …

Wild! A very tantalizing result 😊. While the single center data point is not quite significant, it is likely the linear regression approach leaves a lot of variance on the table.
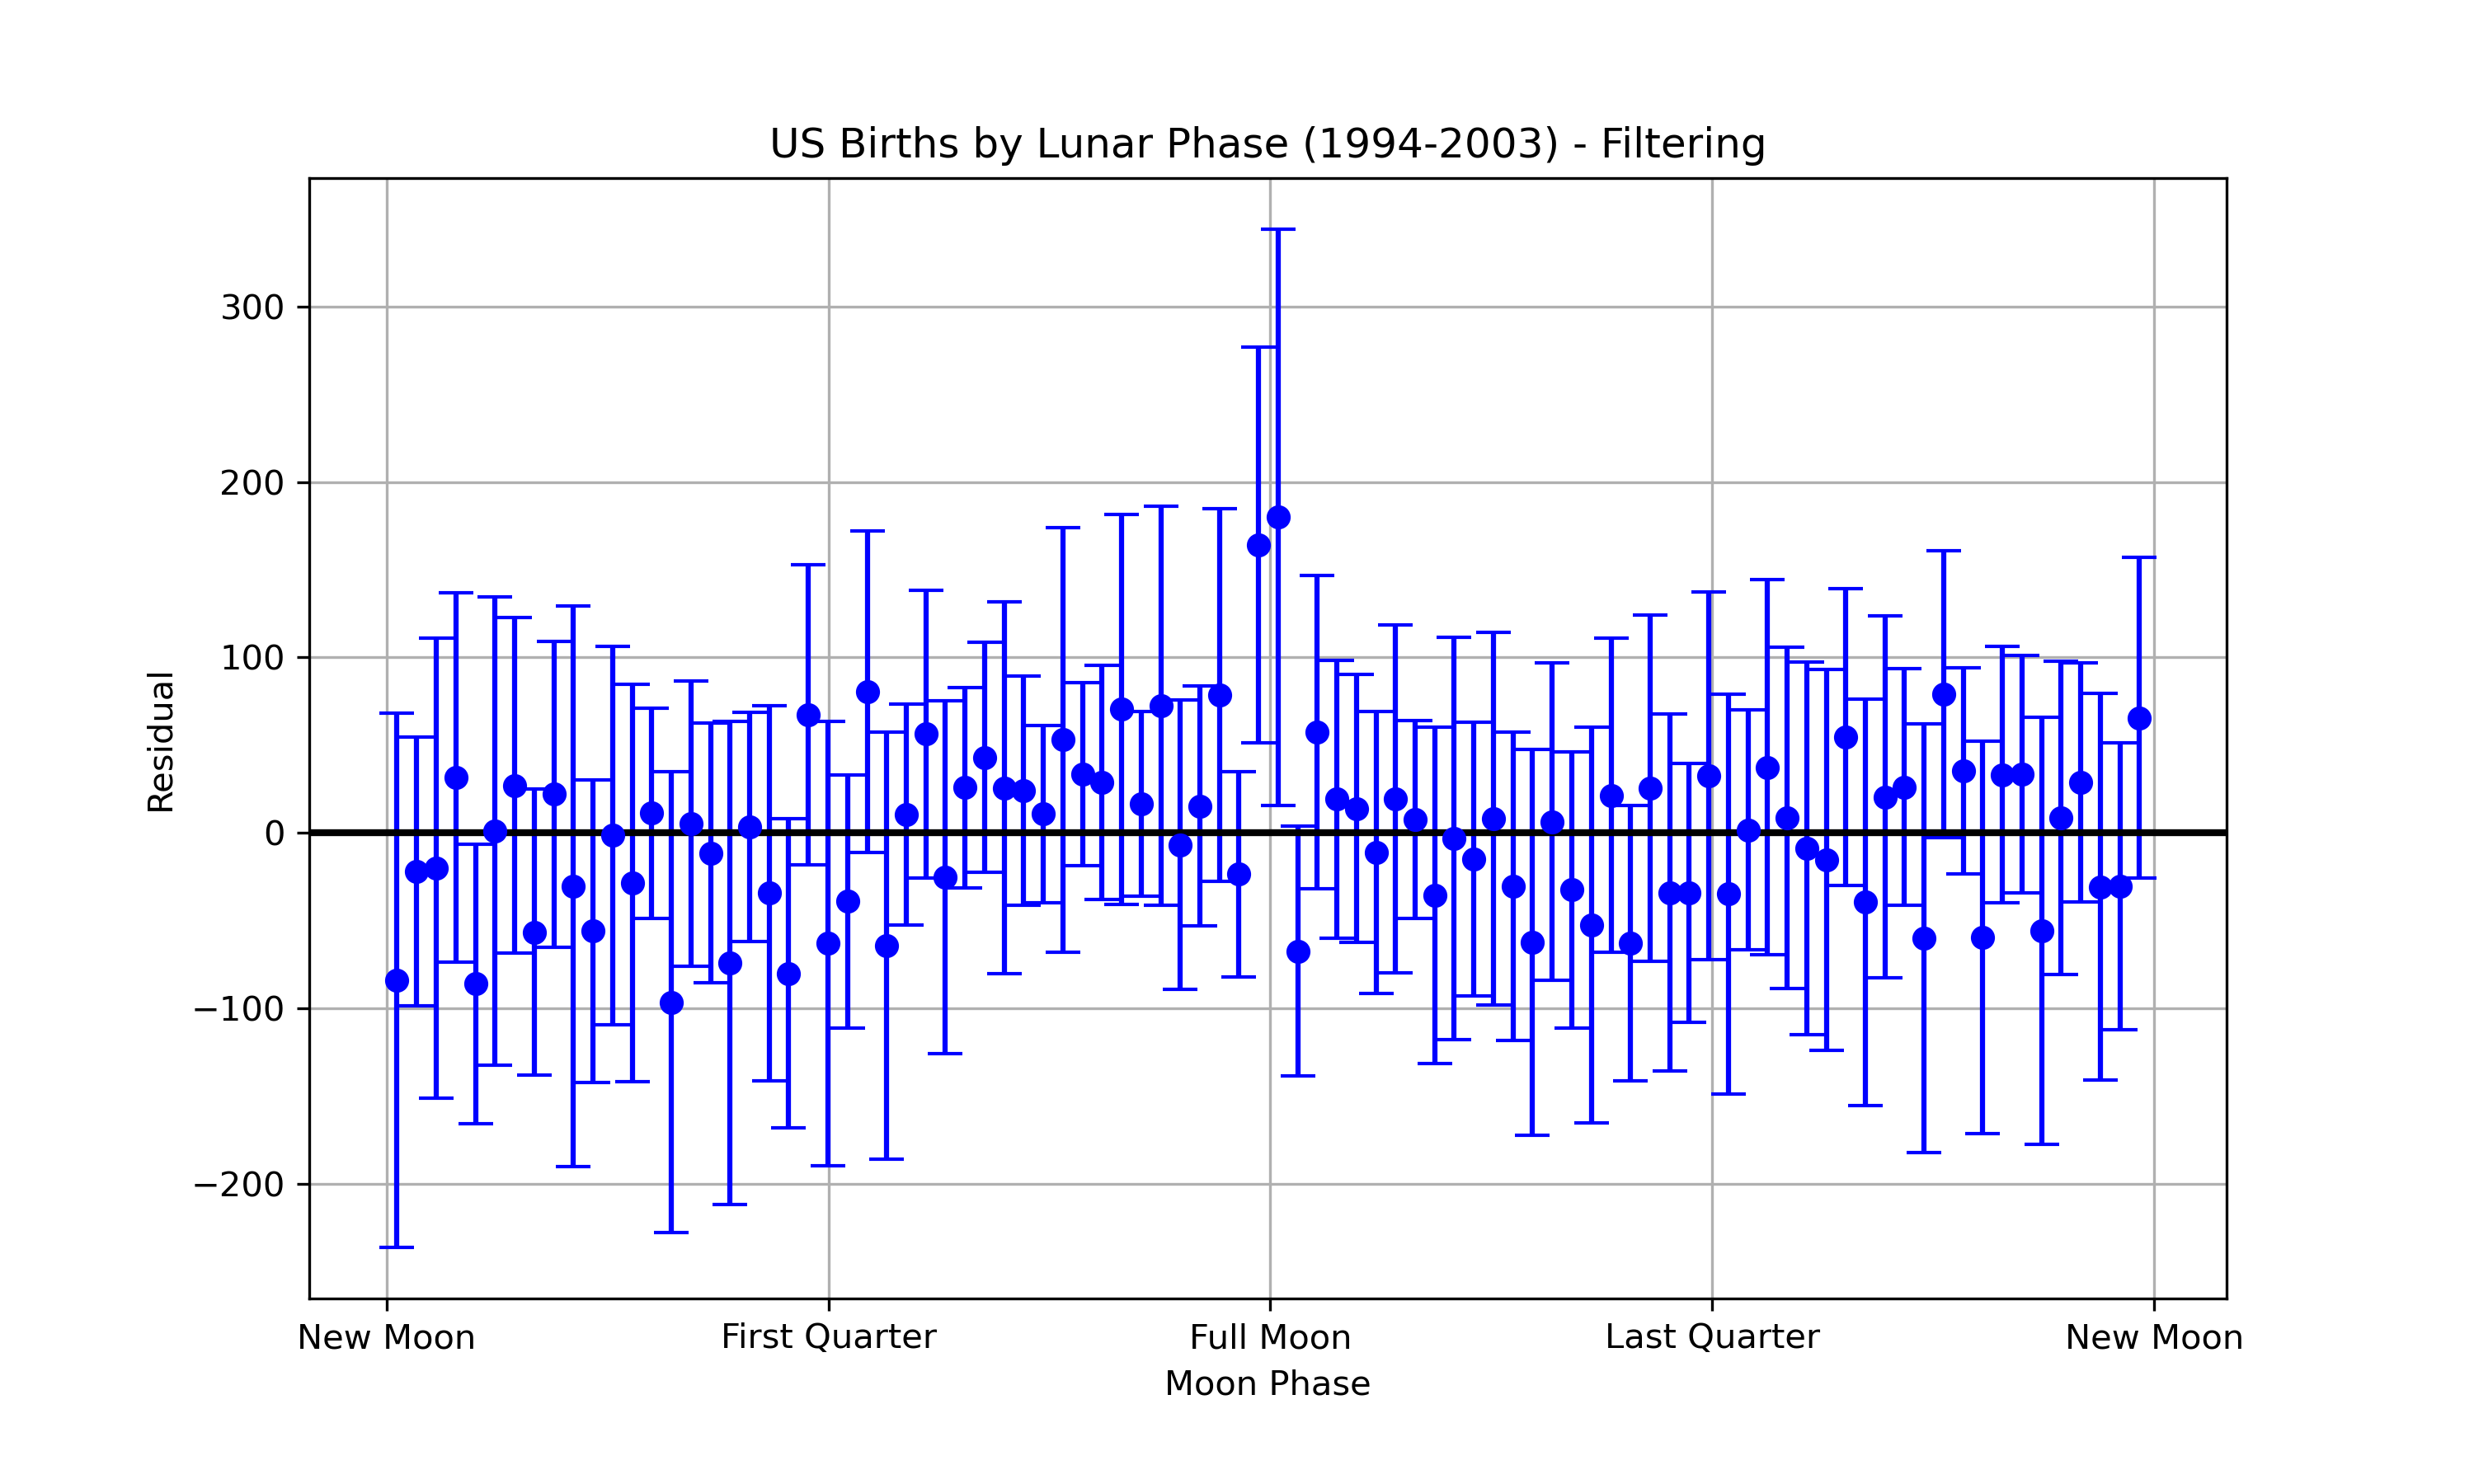
An alternative to specifying an explicit regression model is to simply band-pass the time series data. An FFT of the residuals of the linear regression show that there are still some pretty strong periodic signals in the data that we are not controlling for. While ideally we would determine what is causing the periodic signals, for the sake of time, I also calculated the results based on band-pass filtering with a window for frequencies that have periods between 10-50 days. These simple results, are even more tantalizing

Ideally, we would construct an autoregressive model that specifies exactly what variance we are controlling for. However, I didn’t want to let the perfect be the enemy of the good. It seems more babies might be born on Full moons. The data used to create these figures can be downloaded here. So, what do you think? Add your comments below!
Stephen